The current ratio is a metric used by the finance industry to assess a company’s short-term liquidity. It reflects a company’s ability to generate enough cash to pay off all debts should they become due at once. While this scenario is highly unlikely, the ability of a business to liquidate assets quickly to meet obligations is indicative of its overall financial health.
Components of the Current Ratio
Current Assets
Current assets are located on the balance sheet and represent the value of all assets that can reasonably expect to be converted into cash within one year. The following are examples of current assets:
- Cash and cash equivalents
- Marketable securities
- Accounts receivable
- Prepaid expenses
- Inventory
Current Liabilities
Current liabilities are a company’s debts or obligations that are due within one year, appearing on the company’s balance sheet. The following are examples of current liabilities:
- Short-term debt
- Accounts payables
- Accrued liabilities and other debts
How to Calculate the Current Ratio
The current ratio shows the proportion of current assets to current liabilities is calculated by the following formula:

Example of the Current Ratio
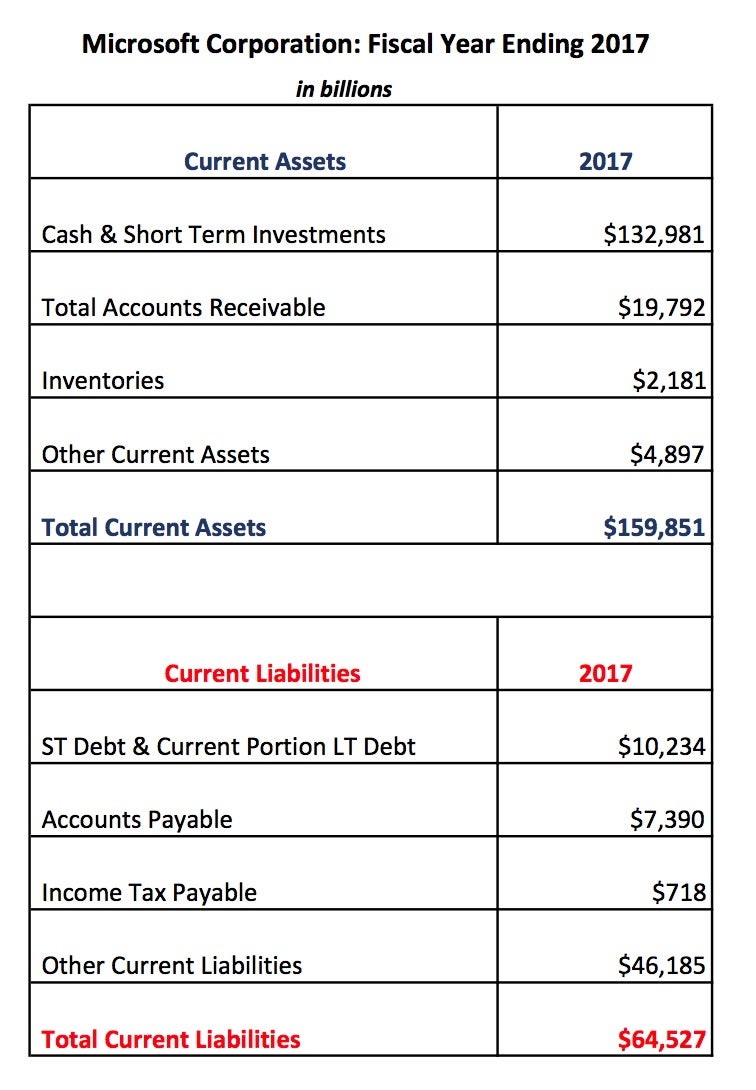
Below are the current assets and current liabilities for Microsoft Corporation (MSFT) as stated on the company’s balance sheet at the end of 2017.
To determine Microsoft’s current ratio, we divide current assets by their current liabilities:
Current ratio = $159,851,000 ÷ $64,527,000 = 2.48
Investors and analysts would consider Microsoft’s current ratio of 2.48 to be financially healthy, meaning the company is easily capable of paying off its obligations.
The Bottom Line
The current ratio provides investors insight as to whether a company has the ability to generate enough cash to pay off all debts should they become due simultaneously. The higher the ratio, the more current assets a company has at its disposal to pay off its obligations. While acceptable ratios vary depending on the specific industry, a ratio between 1.5 and 3 is generally considered healthy.
Liquidity problems can arise for companies that have difficulty collecting their receivables. A ratio below 1 implies that a company might be unable to pay off its short-term obligations if all of the obligations came due at the same time. A ratio under 1 does not necessarily mean that a company will go bankrupt since it may be able to secure other forms of financing. However, a current ratio below 1 indicates the company may be in poor financial health. Conversely, a ratio that’s too high may indicate that the company is not efficiently using its current assets or short-term financing.
When analyzing the current ratio as in the case of most financial ratios, it’s best to compare companies to their industry peers with similar business models to establish what level of liquidity is the industry standard. Also, it’s important to note that no single ratio can provide a comprehensive view of a company.