Net present value (NPV) is a core component of corporate budgeting. It is a comprehensive way to calculate whether a proposed project will be value added or not. The calculation of NPV encompasses many financial topics in one formula: cash flows, the time value of money, the discount rate over the duration of the project (usually WACC), terminal value and salvage value.
This is not a beginner’s topic, and it is recommended you read the above topics first. (For related reading, see What are the disadvantages of using net present value as an investment criterion?)
Net Present Value Defined
Let’s examine each step of NPV in order. The formula is:
NPV= ∑ {After-Tax Cash Flow / (1+r)^t} – Initial Investment
Broken down, each period’s after-tax cash flow at time t is is discounted by some rate, r. The sum of all these discounted cash flows is then offset by the initial investment, which equals the current NPV.
Any NPV greater than $0 is a value-added project, but in the decision-making process among competing projects, the one with the highest NPV is the one that should be chosen. One pitfall in this approach is that while financially sound from theory point of view, an NPV calculation is only as good as the data driving it. Coming up with the correct assumptions (acquisition and disposition costs, all tax implications, the actual scope and timing of cash flows) is extremely difficult. This is where the majority of the work actually takes place. If you have the data, plugging it in is easy.
Calculating NPV in Excel
There are two ways to calculate NPV in Excel, one is by just using one of the built in NPV formulas, the second is by breaking out the component cash flows and calculating each step individually, then using those calculations to produce NPV.
The second method is preferable because financial modeling best practices require calculations to be transparent and easily auditable. The trouble with piling all of the calculations into a formula is that you can’t easily see what numbers go where, or what numbers are user inputs or hard coded. The other big problem is that the built in Excel formula will not net out the initial cash outlay. Believe it or not, you actually have to manually add it back in if you used the built-in formula. This is why we recommend and demonstrate the first approach.
Here is a simple example. What makes this example simple among other things is that the timing of cashflows is both known and consistent (discussed further below).
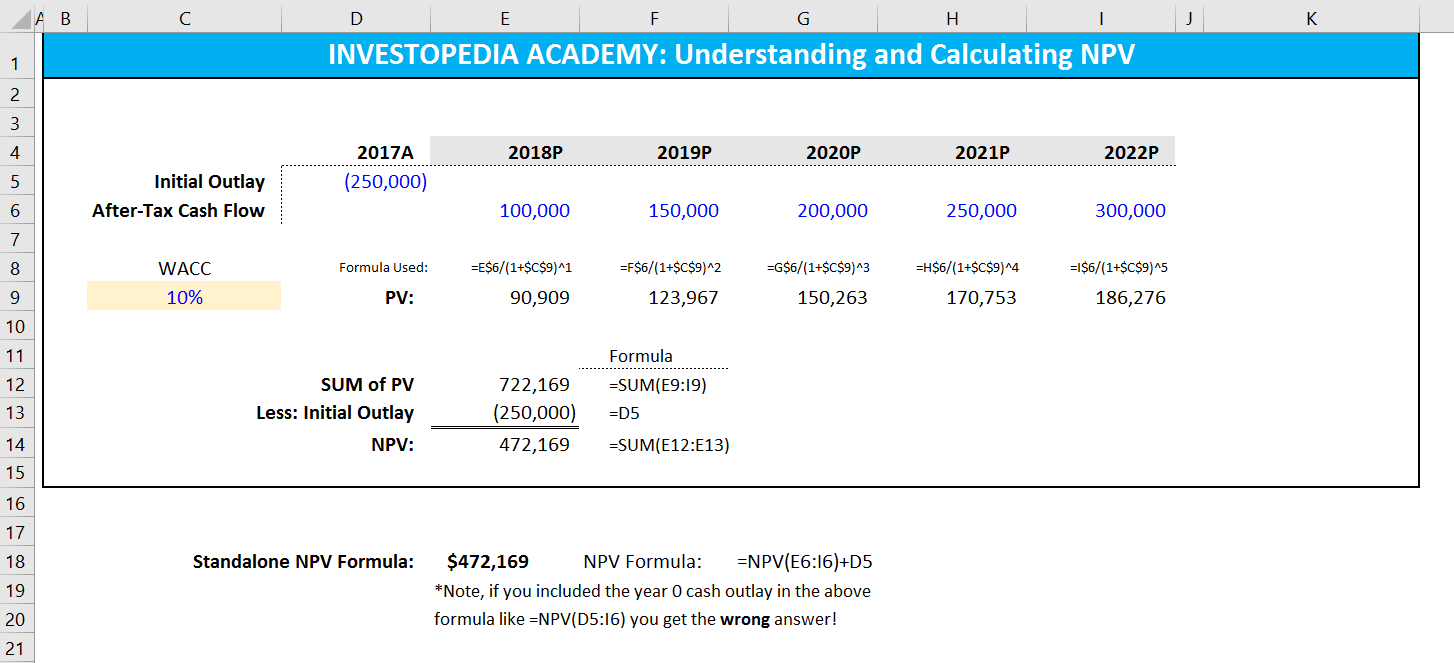
Assume a company is assessing the profitability of Project X. Project X requires $250,000 in funding and is expected to generate $100,000 in after-tax cash flows the first year, and then grow by $50,000 for each of the next four years.
You can break out a schedule as follows:
[Right-Click and open image in new window if hard to read]

NPV Complications
The above example covers all the steps, but there are a few simplifications. First, the assumption above is that all cash flows are received in one lump sum at year end. This is obviously unrealistic. In the real world, not only is it unlikely that you would only perform this analysis at year-end, but it’s also improbable you’d receive 100% of after-tax cash flows on that date. (Learn more formu…